
Clear plan delivers improved results
Review of operations
Key financial indicators
| 364 days 2014 |
Normalised trading calendar 364 days (pro forma)* 2013 |
Comparable pro forma % change* |
As previously reported 368 days 2013 |
% change |
|
| Total till sales | R73.0 billion | R67.8 billion | 7.6 | R68.5 billion | 6.5 |
| Turnover | R63.1 billion | R58.6 billion | 7.7 | R59.3 billion | 6.5 |
| Gross profit margin | 17.5% | 17.5% | 17.4% | ||
| Trading profit | R1 010.3 million | R751.7 million | 34.4 | R852.4 million | 18.5 |
| Profit before tax | R833.1 million | R708.2 million | 17.6 | R808.9 million | 3.0 |
| Basic earnings per share | 122.01 cents | 100.50 cents | 21.4 | 115.14 cents | 6.0 |
| Headline earnings per share** | 138.51 cents | 96.66 cents | 43.3 | 111.30 cents | 24.4 |
| Total annual dividend per share | 92.30 cents | 84.00 cents | 9.9 |
| * | The Group implemented a 52-week financial reporting calendar in February 2013. The 2014 financial year consists of 364 trading days of turnover and related gross profit, compared with 368 days in the prior year. Reviewing turnover and gross profit on a comparable 364-day basis is more meaningful and as such, the results in this commentary are presented on a comparable pro forma basis (unless otherwise stated). For a detailed explanation on the new financial calendar and its impact on the comparability of performance, please refer to note 2 of the summarised financial information presented here. |
| ** | The difference in the growth in headline earnings per share against basic earnings per share is the exclusion of profits and losses of a capital nature in the calculation of headline earnings. Capital losses net of tax of R78.9 million are added back to headline earnings in 2014 (mainly comprising the impairment of intangible assets), against a deduction net of tax of R18.4 million of capital profits in 2013. Please refer to note 6 of the summarised financial information presented here. |
The Group has delivered an improved financial performance compared to the previous year, substantively delivering on the objectives set at the beginning of the year.
The Group increased turnover by 7.7% (compared to 6.2% the previous year). This was driven in part by an accelerated programme of new-store growth. Like-for-like growth was subdued at 2.7%, reflecting the difficult trading environment across the sector. Customers are facing increasing financial pressure as a result of rising fuel, electricity and other utility costs, rising interest rates and levels of household debt. The weak rand is also contributing to rising commodity and consumer goods prices.
The gap between Pick n Pay’s growth and overall market growth narrowed from 2.5% in the previous year to 0.7% this year.
Strong financial control is crucial in this environment. The Group’s improved financial performance reflects in large measure the encouraging progress made over the past year in reducing cost through greater organisational and operating efficiency and tighter fiscal control across the business. We reduced our trading expenses as a percentage of turnover from 17.1% to 16.7% and our trading profit margin improved from 1.3% to 1.6%.
The increase in turnover and reduction in trading expenses has delivered headline earnings per share which are up 43.3% on a comparable pro forma basis. The total dividend per share for the year is 92.30 cents, up 9.9% on the prior year, in line with the Group’s policy to moderate the dividend cover to 1.5 times headline earnings per share.
Our strategy remains that of customer-focused and sales-led growth. Lower costs will enable us to invest more in our shopping trip, driving turnover growth by consistently improving our product offer, stock availability and customer service.
Clear plan: delivers stronger operations
We are a stronger business than we were 12 months ago. We are better positioned to strengthen and grow our core South African business, and actively explore new strategic opportunities in the rest of Africa.
Despite the more challenging trading environment, the Group grew at every level, serving more customers than last year, in more stores and with higher value baskets.
The Group opened 111 new stores during the year and closed 26 under-performing stores, adding 3.4% net new space. We grew our Pick n Pay and Boxer brands across a variety of retail formats, ranging from stores which serve lower-income communities through to our new Waterfront store in Cape Town. We are particularly proud to be serving some communities for the first time, including Chatsworth, KwaMashu and Hammersdale, which demonstrates the strength and inclusiveness of our brand. We are under-represented in the market that our Boxer brand serves and we look forward to expanding our footprint in these areas. The Group now has 1 076 stores, comprising 643 company-owned stores and 433 franchise stores, across multiple retail formats and six southern African countries. In addition 52 stores, three of which trade under the Pick n Pay brand, are operated in Zimbabwe by our associate, TM Supermarkets. Our franchisees remain crucial partners in our business, exemplifying the Pick n Pay commitment to excellent customer service and we are grateful to each of them for their hard work and entrepreneurship over the past year.
We are keenly focused on improving the quality of our fresh and perishable produce and our pre-packaged convenience ranges, and are seeing good results in these areas. We are experiencing good growth in our smaller convenience formats, reflecting the growing customer desire to shop more often in locations which are easy to reach. While our larger Hypermarket stores remain under pressure, we are implementing plans to improve the customer offer and experience in each individual Hyper. Our general merchandise team has made good progress in rationalising and focusing our general merchandise range. This will have a positive impact across the business, particularly in our Hypermarkets. Our smaller clothing and liquor formats continue to perform well and make meaningful contributions to the turnover and profit growth of the business. We will introduce expanded and targeted clothing ranges into our supermarkets next year. We have grown our online food delivery business by 27% over the year. We now serve more than 2 000 customers per week, and have extended the service during the year within the Western Cape, KwaZulu-Natal and the Free State.
Customers are more engaged than ever in our smart shopper loyalty programme, which remains South Africa’s favourite loyalty programme. We have made a number of improvements for customers in the course of the year, including offering loyalty points and vouchers on till slips at the point of sale, introducing instant saver promotions and a smart shopper mobile application. We have issued almost eight million smart shopper cards and the number of customers who regularly use their card is growing steadily in response to our enhanced rewards programme.
We have supported our customers with good prices during the year, broadening our mix of promotions and fighting inflation in core commodities by tailoring ranges and promotions to specific communities. Our smart shopper programme provides us with valuable information in this regard, assisting us to tailor and target promotions where and when they will be most effective.
This is in line with our strategy to continue to invest in the shopping trip. Our gross profit margin remains unchanged at 17.5%, with savings generated through improvements in supply-chain efficiency being reinvested in our customer offer.
We are pleased with the progress made across our buying and distribution channels. We continue to bring more suppliers into our central distribution channels, increasing the volume through our distribution centres by 10.8% over the year, and reducing the cost per case delivered by 6.5%.
The benefits of our central distribution strategy are increasing, with improved efficiencies and meaningful cost reductions across our supply chain, including removing four-days value of inventory from our stock levels, providing our stores with strike-rates that are significantly better than those of direct to store suppliers and improving overall availability by 2.4 percentage points.
We completed the centralisation of our buying, operational and finance support functions, removing duplicate costs and services in the business. This process necessitated tough decisions during the year and resulted in the retrenchment of some head office support staff. This was a difficult time for the business, but the rigorous review of all support structures and processes has enabled us to create a more streamlined and effective support office.
Outside South Africa we increased segmental revenue by 27.9% on a comparable basis and increased our like-for-like segmental revenue by 9.4%. In the course of the year we took clear and decisive action to close our Mauritius and Mozambique franchise operations. In both cases we reached a firm conclusion that the businesses, as they were structured did not offer us a sound basis for sustainable growth. However, the prospects are strong in the markets in which we continue to operate and further afield. We have experienced good growth in Zambia, and have installed a team on the ground in Nigeria to explore opportunities in that market.
We are proud of the leadership that Pick n Pay demonstrates as a responsible and caring corporate citizen, whether it is supporting local charities and good causes in the communities we serve, helping grow emerging market suppliers through our collaboration with the Ackerman Pick n Pay Foundation, or leading on seafood sustainability and climate change. The welfare and sustainability of the communities we serve is close to our hearts and has always been a key part of our approach.
Clear plan: more to do
We are encouraged by the progress shown across the business over the past year. Our strategic goal remains that of sustainable customer-driven and sales-led growth, and the Group has more to deliver in terms of improving our customer offer and winning more customers to Pick n Pay. We have a clear plan in place across the Group, organised on the basis of a balanced scorecard comprising five segments: our customer offer, our operations, the organisation of our people, our relationship with the communities we serve, and our financial performance. By delivering this plan, customers will experience a better Pick n Pay. We will become more efficient and reduce our costs further. Staff will be part of a more effective organisation. We will as a result deliver better returns to our shareholders and an even stronger contribution to society and our broader stakeholders.
Financial review
Turnover
Group turnover increased by 7.7% to R63.1 billion (2013: R58.6 billion, with 6.2% comparable growth). Like-for-like turnover growth was 2.7% (2013: 3.0%) and net new stores contributed 5.0%, with our trading space growing a net 3.4% over the year. We showed stronger like-for-like growth at overall point of sale level, with like-for-like till sales from both owned and franchise stores growing by 3.5%. Pick n Pay internal selling price inflation for the year was 5.3% (2013: 4.9%), against CPI inflation of 5.8%.
Gross profit
The Group has maintained the gross margin at 17.5%. We are pleased with the progress made across our buying and distribution channels, which has resulted in improved efficiencies and meaningful cost reductions. In particular our two central distribution centres, at Longmeadow in Gauteng and Philippi in the Western Cape, have both delivered considerable operating improvements which have reduced the net cost of distribution as a percentage of turnover. We have also demonstrated improved control over waste and shrink which are below the levels of the previous year. In addition, our new reporting platform is enabling improved gross margin management through the enhanced visibility of more timely information. All the cost savings realised have been reinvested back into the selling price of goods, as part of our strategy of investing in the shopping trip.
Other trading income
Certain elements of trading income previously included under cost of merchandise sold (within gross profit) have been reclassified and disclosed separately. This has been done to improve the visibility of all other trading income, specifically commissions received. The prior year has been restated to align with the current year disclosures, please refer to note 7 of the summarised financial information presented here. The 3.5% decrease in other trading income is mainly due to reduced commissions as customers move away from purchasing airtime at the till to other digital platforms.
Trading profit
The trading profit margin improved from 1.3% to 1.6%. Expense control has been the key differentiator in our improved performance this year, countering the modest turnover growth and continued investment in gross profit margin. Trading expenses as a percentage of turnover have decreased from 17.1% to 16.7%, with like-for-like expense growth almost flat at 0.8%. We are pleased with the good work being done around tighter fiscal control, with all areas of the business contributing to the expense savings.
The following are good examples of the achievements over the past year:- The increase in employee costs was limited to 7.6%, notwithstanding the new store growth. Furthermore, like-for-like employee costs increased by only 3.2% despite a new above-CPI wage rate agreement which came into force at the beginning of the financial year. This demonstrates increased productivity at store level, which is enabling us to staff our stores more efficiently and effectively.
- Occupancy costs are up 7.6% in line with our store expansion programme; however the like-for-like increase is only 2.6%. This is pleasing in light of the continued above-CPI regulatory increases in rates and taxes. We remain a tenant of choice in the retail industry and continue to negotiate competitive rentals and escalation terms with our landlords.
- Costs of operations are up 9.2%, again reflecting our opening of 80 company-owned stores during the year, with a like-for-like increase in costs of 4.1%. Administered increases in electricity prices are posing a significant additional burden on operational costs. We are able to mitigate this to some degree: our electricity usage is well controlled, and we have an effective programme of reducing energy use in our stores. Amortisation and depreciation has increased by 5.9%, compared with the 10.8% growth seen in 2013, which illustrates the good work being done around the control of capital expenditure and ensuring the spend is targeted at improving the customer offer.
- We are very pleased with the progress made on eliminating excess administrative costs in the business, particularly at support office level. Merchandise and administration expenses have decreased by 14.8%, with a like-for-like decrease of 17.9%. We have almost entirely removed consultancy costs from the business. As South Africa’s largest acceptor of electronic tender, we have been subject to increased bank fees as our customers move from debit cards to hybrid cards. We are encouraged that the Reserve Bank has taken action to reduce bank interchange fees in respect of credit, debit and hybrid costs. The reduced fee schedule is expected to be in force from 1 January 2015, with the benefits flowing in the 2016 financial year.
There is still a great deal of work to be done to optimise our cost structure and augment our productivity and efficiency, but we are demonstrating that we can run a lower cost, more streamlined business.
Loss on capital items
The Group completed the centralisation of its buying, operational and finance support functions during the year. As a result, systems and reporting tools previously developed to support the decentralised business operation became obsolete, necessitating an impairment of R104.1 million of those intangible assets. The loss on capital items also includes a loss on the sale of fixed assets of R5.5 million, against a profit of R21.6 million in the prior year.
Interest
The net interest expense of R99.6 million is R11.1 million more than the prior year’s expense of R88.5 million due to periods of elevated borrowings, particularly in the first half of the year, as a result of increased capital expenditure and inventory provisioning relating to new stores.
Earnings per share
Basic earnings per share (EPS) increased 6.0% from 115.14 to 122.01 cents per share. The new 52-week reporting calendar resulted in the current reporting period being four trading days less than the prior year. The comparable EPS growth (if the impact of 14.64 cents per share attributable to the additional trading days is excluded) is 21.4%.
Headline earnings per share (HEPS) increased 24.4% from 111.30 to 138.51 cents per share. The new 52-week reporting calendar resulted in the current reporting period being four trading days less than the prior year. The comparable HEPS growth (if the impact of 14.64 cents per share attributable to the additional trading days is excluded) is 43.3%.
The significant difference in the growth in headline earnings per share against basic earnings per share is the exclusion of profits and losses of a capital nature in the calculation of headline earnings.
Capital losses net of tax of R78.9 million are added back to headline earnings in 2014 (mainly comprising the impairment of intangible assets), against a deduction net of tax of R18.4 million of capital profits in 2013.
Financial position
| Sunday 2 March 2014 Rm |
Sunday 3 March 2013 Rm |
|
| Inventory | 3 979.8 | 3 996.5 |
| Other current assets | 2 844.6 | 2 361.1 |
| Cash and cash equivalents | 1 540.3 | 1 255.7 |
| Bank overdraft and overnight borrowings | (670.0) | (1 525.6) |
| Other current liabilities | (8 942.2) | (7 382.4) |
| Net working capital | (1 247.5) | (1 294.7) |
We are pleased with the slight improvement in net working capital, particularly in the context of the store expansion programme. Inventory has decreased by R16.7 million or 0.4%, with like-for-like inventory (excluding the impact of new stores) decreasing by 5.7%. We have been focused on removing slow-moving inventory lines from our business, rationalising our product range to provide our customers with a more focused and relevant offering, as well as improving our supply chain efficiencies with improved strike rates to stores. We are pleased with our progress in this area, but there is still much work to be done. The increase in trade and other receivables of R480.0 million mainly relates to 12 net new franchise stores. The net cash and overnight borrowing position at year-end has improved by R1 140.2 million on last year, from negative R269.9 million to R870.3 million. The improved cash position is testament to the good work being done in respect of inventory management and improved fiscal control over both capital and operating expenditure. We raised an additional R300 million borrowing under our DMTN programme to capitalise on competitive interest rates in the capital markets.
Shareholder distribution
In line with our review of all aspects of the business, the Board moderated the annual dividend cover to 1.5 times headline earnings per share. The final dividend of 77.50 cents per share brings the total dividend for the annual period to 92.30 cents per share, which is 9.9% up on last year.
Prospects
It has been a challenging but rewarding year and we are pleased with this overall result. We are encouraged by the improved financial performance delivered and the progress demonstrated across all areas of our business. Our business is stronger than it was a year ago. Customers and shareholders are experiencing the benefit. Much work lies ahead in what is a difficult trading environment. We have a clear plan to improve the shopping trip for our customers, drive higher turnover growth, and deliver further operating efficiencies and cost savings. We thank all our staff who have worked so hard over the past 12 months to improve our business and the lives of our customers.
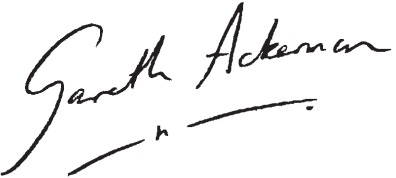
Gareth Ackerman
Chairman

Richard Brasher
Chief Executive Officer
14 April 2014
Dividend declarations
Pick n Pay Stores Limited – Tax reference number: 9275/141/71/2
Number of shares in issue: 480 397 321
Notice is hereby given that the directors have declared a final gross dividend (number 92) of 77.50 cents per share out of income reserves.
The dividend declared is subject to dividend withholding tax at 15%.
There is no secondary tax on companies (STC) to be taken into account when determining the dividend tax to withhold.
The tax payable is 11.625 cents per share, leaving shareholders who are not exempt from dividends tax with a net dividend of 65.875 cents per share.
Dividend dates
The last day of trade in order to participate in the dividend (CUM dividend) will be Friday, 6 June 2014.
The shares will trade EX dividend from the commencement of business on Monday, 9 June 2014 and the record date will be Friday, 13 June 2014. The dividends will be paid on Tuesday, 17 June 2014.
Share certificates may not be dematerialised or rematerialised between Monday, 9 June 2014 and Friday, 13 June 2014, both dates inclusive.
On behalf of the board of directors

Debra Muller
Company Secretary
14 April 2014