 |
| |
 |
| |
Environmental responsibility |
|
 |
|
|
|
| |
- Reducing the carbon footprint of our retail stores, distribution centres and offices
- Reducing the generation of waste at our retail stores, distribution centres and offices
- Actively promoting innovative initiatives relating to packaging, products and store design
- Establishing new partnerships to promote more sustainable and ethical sourcing
- Making it easier for our customers to meet their own environmental responsibility
|
|
|
|
| |
|
|
|
|
|
|
| |
- Action at store level to meet energy and waste commitments and reduce chemical use
- Focus on e-waste: responsible disposal of IT equipment following the implementation of SAP programme.
Formulating nationwide e-waste strategy
- As part of our ongoing “power pledge” energy-saving campaign for staff and customers, in partnership
with Eskom, we distributed 50 000 vouchers, each offering 75% off the price of a Cfllamp, in our stores
- Reduced our local business travel through greater use of virtual communications and more stringent travel
policies
- Packaging initiatives across food and general merchandise divisions leading to reductions in packaging and
cost savings – focus going forward on quantifying and tracking performance
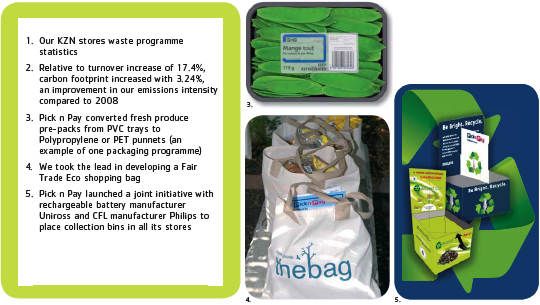
- Introduced Cfland battery recycling facilities in all our stores and will be adding facilities for plastic bags
and ink cartridges
- Wind turbine system installed at our regional office in Port Elizabeth to generate electricity and pilot solar
heating installed at our Longmeadow distribution centre to provide hot water
- Continuing to action the biodiesel from waste project; we have appointed contracts at key national centres
to collect, process and deliver biofuel to our distribution centres for use as a blend in our trucks
- Building on the success of our integrated waste plan in KZN, we aim to roll out waste recycling to all regions
by the end of the 2010 financial year
- Developed a set of guidelines for the design of eco-effective stores
- Working in partnership with Leadership for Conservation in Africa to develop capacity in developing country
governments in Africa to find solutions to address conservation issues
|
|
|
|
|
|
|
| 1. |
KZN waste figures |
|
|
|
|
| |
KZN Sample stores actual volume |
|
Extrapolated national volume (kgs) |
|
|
|
|
|
|
| |
General waste |
2 092 483 |
57.86% |
29 892 614 |
57.86% |
| |
Glass |
2 100 |
0.14% |
30 000 |
0.14% |
| |
Cans |
2 270 |
0.15% |
32 429 |
0.15% |
| |
Paper |
1 468 752 |
96.38% |
20 982 171 |
96.38% |
| |
Plastic |
50 772 |
3.33% |
725 314 |
3.33% |
| |
Recycling |
1 523 894 |
42.14% |
21 769 914 |
42.14% |
| |
Total kgs |
3 616 377 |
|
51 662 528 |
|
|
| |
| 2. |
Our carbon footprint |
|
|
| |
Source of operational CO2 emissions |
CO2 equivalent
metric tonnes
2008/2009 |
CO2 equivalent
metric tonnes
2007/2008 |
|
|
|
|
| |
Energy usage at stores, distribution centres and offices |
735 600 |
721 200 |
| |
Diesel usage from commercial fleet and company vehicles |
24 582 |
15 172 |
| |
Petrol usage from commercial fleet and company vehicles |
7 487 |
7 353 |
| |
Business air travel |
914 |
686 |
| |
*Total |
768 583 |
744 414 |
|
| |
*This does not include store and office refrigeration and air conditioning gases. |
|
| |
 |


