chief finance officer’s report
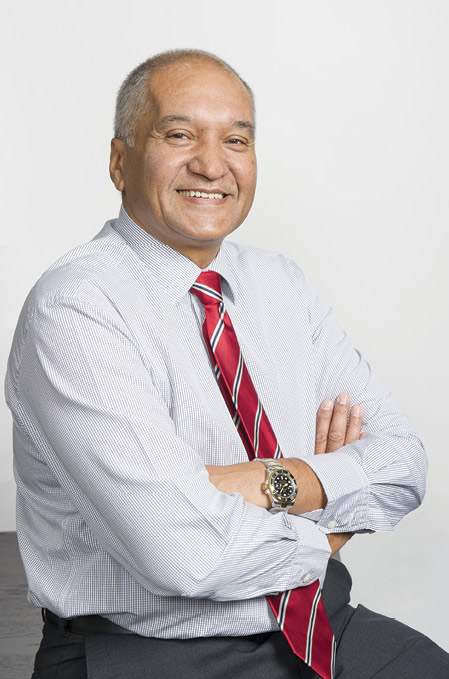
Bakar Jakoet
Rigorous control of capital and operating spend, combined with concerted action to strengthen the business for the long term, drove headline earnings per share up 28.0% on last year.
Pick n Pay Stores Limited
Key financial indicators
52 weeks to 1 March 2015 |
52 weeks to 2 March 2014 |
% change |
|
Turnover |
R66.9 billion |
R63.1 billion |
6.1 |
Gross profit margin |
17.8% |
17.5% |
|
Trading profit |
R1 240.1 million |
R1 010.3 million |
22.7 |
Trading profit margin |
1.9% |
1.6% |
|
Profit before tax |
R1 205.2 million |
R833.1 million |
44.7 |
Profit before tax margin |
1.8% |
1.3% |
|
Basic earnings per share |
178.79 cents |
122.01 cents |
46.5 |
Headline earnings per share |
177.26 cents |
138.51 cents |
28.0 |
Total annual dividend per share |
118.10 cents |
92.30 cents |
28.0 |
Overview of financial result
Pick n Pay delivered a solid financial performance in the 2015 financial year. Rigorous control of capital and operating spend, combined with concerted action to strengthen the business for the long term, contributed to the headline earnings per share increase of 28.0%. Trading profit increased by 22.7%.
Group turnover growth of 6.1% reflected the financial pressure on especially middle-income customers, with the South African economic climate continuing to be characterised by high unemployment, elevated levels of household debt, a weak rand and rising utility costs. In addition, this year we took key strategic steps to improve the quality of our estate, including the closure of a number of under-performing stores and commencing a substantial refurbishment programme in the second half of the year. While this action strengthened the business for the future, it inevitably impacted turnover growth in the reporting year.
The gross profit margin increased by 30 basis points from 17.5% to 17.8% of turnover, notwithstanding the investment in price through our Brand Match campaign and Smart Shopper loyalty programme.
The increasingly effective management of costs, together with the realisation of greater operating efficiencies, limited the increase in like-for-like trading expenses to 3.8%, well below CPI for the year of 5.8%. Trading profit margin improved by 30 basis points from 1.6% to 1.9%.
More stringent financial control and tighter working capital management resulted in consistently stronger cash balances over the year, enabling the repayment of R700 million of medium-term debt under the DMTN Programme. This delivered a 40.2% reduction in net finance costs.
Detailed review of financial result
Turnover
52 weeks to 1 March 2015 Rm |
52 weeks to 2 March 2014 Rm |
% change |
|
Group turnover |
66 940.8 |
63 117.0 |
6.1 |
South Africa division |
63 911.9 |
60 381.0 |
5.8 |
Rest of Africa division |
3 028.9 |
2 736.0 |
10.7 |
The Group took strategic action during the year to close 14 under-performing stores. These closures, together with the 26 stores closed in the previous financial year, had a negative impact on turnover growth. The Group also embarked on a substantial refurbishment programme in the second half of the year, beginning the journey of refitting and modernising a number of Hypermarkets and large supermarkets.
These actions improved the quality of our estate and strengthened the business for the future but caused some short-term disruption to trade.
The Group opened 127 stores during the year across all Pick n Pay and Boxer formats, including 36 new supermarkets. The 113 net new stores added 5.2% to space. The retail market is increasingly competitive with a number of our competitors undertaking accelerated store opening programmes. Pick n Pay’s cautious approach to new space growth meant that we lagged the market in expansion while our stores felt the impact of competitor openings. The Group is determined, however, to grow new space only where it is confident that doing so can deliver strong and sustainable returns.
Like-for-like sales growth of 3.6% was up from 2.7% in the prior year with our customer count and basket size increasing 2.4% and 4.0% respectively. All metrics reflect improvements in our customer offer achieved through a number of new initiatives launched over the course of the year. We are seeing positive signs of inflation moderating, with internal selling price inflation falling to 6.3% in the second half of the year, against the 6.7% recorded for the first half of the year.
The turnover growth of 5.8% in the South Africa division reflected the tough economic climate in this country. Consumers in South Africa have come under increasing financial pressure over the past year. This was a particularly challenging year for our Boxer business which operates in the lower-income, emerging-market communities of South Africa. The business faced increased competition from both formal retailers and informal traders, against the backdrop of mining and industrial strikes, power cuts and service delivery protests. We were, however, pleased with the efforts of our Boxer team, who continue to drive tremendous cost efficiency across the business, in order to deliver competitive prices to those customers who need it the most.
The Rest of Africa division delivered good growth with segmental turnover and segmental revenue (including direct supplier deliveries) up 10.7% and 13.6% respectively, notwithstanding the weakening of the Zambian kwacha against the South African rand and the closure of our franchise operations in Mozambique and Mauritius in the previous year. Segmental revenue growth in constant currency terms was 16.6%. We continued to expand and improve our operations outside South Africa, opening two stores in Zambia during the year and eight in Namibia while closing three under-performing stores in that country. We continued with the sizeable store refit programme in Zimbabwe over the year, refurbishing four TM Supermarkets and rebranding a further three stores to the Pick n Pay brand. The opening of two new stores in Zimbabwe and the closure of one store during the year brought the total number of TM Supermarkets to 53, of which eight trade strongly under the Pick n Pay banner.
Gross profit
Gross profit increased by 8.2% to R11.9 billion with our procurement and supply chain channel delivering pleasing performances. The business delivered a 30-basis point improvement in gross profit margin, from 17.5% to 17.8% alongside continued investment in price through Brand Match and Smart Shopper, and keener promotions over the course of the year. Our investment in, and focus on, centralised procurement and supply chains, including automatic forecast and replenishment, delivered improvements in availability for customers, more efficient and lower-cost operations, better inventory management and more productive use of space in stores.
Other trading income
52 weeks to 1 March 2015 Rm |
52 weeks to 2 March 2014 Rm |
% change |
|
Other trading income |
602.9 |
500.6 |
20.4 |
Franchise fee income |
294.4 |
311.2 |
(5.4) |
Operating lease income |
67.3 |
77.8 |
(13.5) |
Commissions and other income |
241.2 |
111.6 |
116.1 |
Other trading income increased by 20.4% to R602.9 million. The increase was largely due to commissions earned on value-added services, which more than doubled over the period. While value-added services are a good growth opportunity for the business, and growth in this area was strong in 2015, such growth rates depend on new levels of innovation and new product launches, which are unlikely to be replicated every year.
Franchise fee income reduced by 5.4% as a result of the closure of five franchise stores in Mauritius and Mozambique in the previous year.
Operating lease income (rental income) decreased by 13.5% mainly as a result of the cancellation of a substantial head lease, with a corresponding decrease in related rentals paid.
Commissions and other income rose 116.1% as a result of a renewed focus on optimising existing value-added services, including financial services such as mobile money, third-party bill payments, and the sale of gift cards, pre-paid electricity, lotto and travel and event tickets. We will continue to focus on this area, providing our customers with increased convenience and innovation.
Trading expenses
52 weeks to 1 March 2015 Rm |
% of turnover |
52 weeks to 2 March 2014 Rm |
% of turnover |
% change |
Like-for-like % change |
|
Trading expenses |
11 309.3 |
16.9 |
10 530.2 |
16.7 |
7.4 |
3.8 |
Employee costs |
5 653.8 |
8.5 |
5 326.3 |
8.4 |
6.1 |
3.5 |
Occupancy |
1 867.6 |
2.8 |
1 613.9 |
2.6 |
15.7 |
6.9 |
Operations |
2 618.8 |
3.9 |
2 580.5 |
4.1 |
1.5 |
(2.5) |
Merchandising and administration |
1 169.1 |
1.7 |
1 009.5 |
1.6 |
15.8 |
16.9 |
Trading expenses, at 16.9% of turnover, increased by 7.4% in total and by 3.8% on a like-for-like basis.
Employee costs increased 6.1%. On a like-for-like basis, the growth in employee costs was contained at 3.5%, notwithstanding a first time charge of R67.3 million in respect of the new employee forfeitable share plan, which was implemented in August 2014, and an annual wage rate increase which was more in line with CPI. This is evidence of the tangible progress achieved in improving labour productivity and efficiency throughout the Group, through the centralisation and simplification of business processes and systems.
Occupancy costs, which include rent, rates, security and insurance expenditure, increased by 15.7%. Rent paid rose by 18.1% year-on-year, reflecting our space growth over the last year, with like-for-like rental expenses up 7.0%, in line with average annual escalations. Total like-for-like occupancy cost increases were contained at 6.9%, despite regulated increases in rates and property taxes of up to 20%.
Operations costs, which include electricity, utilities, repairs and maintenance, and depreciation and amortisation, were up 1.5% on last year, and 2.5% down on a like-for-like basis, driven by a substantially lower amortisation and depreciation charge in 2015. Among the factors contributing to this reduced charge was the impact of the R104.1 million impairment of intangible assets in the prior year, a large portion of capitalised investment over the previous seven years now being fully depreciated, and a reduction in capital spend over the past 18 months as the Group slowed new space growth and refurbishment to ensure all customer-facing investment added real value and generated sustainable levels of return.
Utility costs rose by 12.3% due to higher diesel and generator maintenance costs – as a direct result of load shedding. However, these costs continued to be mitigated through improved store efficiencies and the effective measures put in place to reduce electricity usage.
A number of IT systems came online during the year and professional fees related to the maintenance and support of these systems contributed to an increase in merchandise and administration costs of 15.8% (16.9% on a like-for-like basis), with R66.8 million of IT support costs now expensed as incurred.
In addition, bank charges increased by 26.6% on last year, reflecting the increased use of electronic tender by our customers. An improvement in our impairment allowance of trade and other receivables, down 71.4% on last year, mitigated other increases in this category, providing encouraging evidence of the improving health of our franchise business.
Trading profit
Trading profit increased by 22.7% to R1 240.1 million. The trading profit margin improved from 1.6% to 1.9%. An improved gross margin and strong expense control underpinned this result, countering subdued turnover growth. There is, however, still considerable scope to optimise our cost structure and improve our productivity and efficiency.
Profit/loss on capital items
In 2014 the Group completed the centralisation of its buying, operational and finance support functions. As a result, systems and reporting tools previously developed to support the decentralised business operation became obsolete indicating that certain intangible assets had to be assessed for impairment. Management estimated the recoverable amount as zero and an impairment of R104.1 million was recognised in the previous reporting period.
The Group realised a gain of R10.4 million on the sale of assets in the current year, against losses of R5.5 million in the prior year.
Net finance costs
52 weeks to 1 March 2015 Rm |
52 weeks to 2 March 2014 Rm |
% change |
|
Net finance costs |
(59.6) |
(99.6) |
(40.2) |
Finance income |
59.4 |
44.3 |
34.1 |
Finance costs |
(119.0) |
(143.9) |
(17.3) |
The net finance cost of R59.6 million was 40.2% down on last year. This was the result of stronger working capital management throughout the year, with a particular focus on inventory management, which resulted in stronger cash balances and enabled the repayment of the medium-term R700 million DMTN Programme debt in June 2014.
Share of associate’s income
TM Supermarkets, the Group’s associate retailing in Zimbabwe, experienced a challenging trading period, with our share of TM’s income falling by 55.3% to R14.3 million. Turnover in the region is under pressure due to a deflationary trading environment, economic and political uncertainty and increasing competition.
Tax
The effective tax rate improved from 29.9% to 28.5%. The effective tax rate benefit was a direct result of our improved profitability, with no corresponding change in the level of non-deductible expenditure.
Earnings per share
Basic earnings per share (EPS) – increased 46.5%, from 122.01 to 178.79 cents per share.
Headline earnings per share (HEPS) – increased 28.0% from 138.51 to 177.26 cents per share.
The significant difference in the growth in headline earnings per share against basic earnings per share relates to the add-back of profits and losses of a capital nature in the calculation of headline earnings. The profit on the sale of assets, net of tax, of R7.4 million was taken into account in the calculation of headline earnings in the current period, against the add-back of capital losses in the prior year of R78.9 million net of tax. The capital loss in the previous year related mainly to the impairment of obsolete IT systems.
Financial position
Sunday 1 March 2015 Rm |
Sunday 2 March 2014 Rm |
|
Inventory |
4 654.5 |
3 979.8 |
Trade and other receivables |
2 956.7 |
2 841.1 |
Cash and cash equivalents |
1 173.8 |
1 540.3 |
Bank overdraft and overnight borrowings |
(500.0) |
(670.0) |
Medium-term borrowings – DMTN Programme |
— |
(700.0) |
Other current liabilities* |
(9 153.6) |
(8 204.4) |
Net working capital |
(868.6) |
(1 213.2) |
* Excludes the short-term portion of long-term borrowings. |
||
We are pleased with the improvement in net working capital of R344.6 million, which reflects the good work across the business in terms of controlling capital and operating expenditure and managing working capital.
Inventory
Overall, we made good strides in removing excess inventory from the business. However, inventory increased by R674.7 million or 17.0% on last year. This reflected the new stores opened during the course of the year as well as an increase in the centralisation of suppliers over the period, which resulted in elevated inventory levels in the short term. In addition, labour disruption at our Longmeadow Distribution Centre, although quickly resolved, led to increased inventory levels at the facility over year-end.
Trade and other receivables
Trade and other receivables increased by only R115.6 million or 4.1%, against the backdrop of a net new 57 franchise stores. This reflected the reduction in our impairment allowance included in merchandise and administration expenses. We remained focused on improving the quality of our debtors’ book and are pleased with our progress in this regard.
Cash and capital management
Working capital management is critical in maintaining a sustainable and cost-effective capital structure. Tighter working capital management and a relentless focus on inventory during the year led to consistently stronger cash balances over the 12 months, allowing for the repayment, as stated above, of the medium-term DMTN Programme debt of R700 million and resulting in a substantially decreased interest charge, notwithstanding the elevated inventory levels at year-end.
The Group utilises long-term interest-bearing borrowings to fund specifically identified capital investment in respect of long-term assets. All capital expenditure is reviewed through a thorough rigorous requisition and approval process.
Capital expenditure for the year
52 weeks to 1 March 2015 Rm |
52 weeks to 2 March 2014 Rm |
|
Expansion into new stores |
377.7 |
592.4 |
Improving existing stores |
438.5 |
319.3 |
Improving the customer experience |
816.2 |
911.7 |
Investing in future infrastructure |
130.6 |
157.8 |
Maintaining current infrastructure |
158.5 |
190.5 |
Total capital investment |
1 105.3 |
1 260.0 |
Of the total capital spend for the year, R816.2 million or 73.8%, was focused on expansion and improving the customer experience. The Group adopted a measured approach to investment in new stores and refurbishments over the last two years to ensure that all capital investment drives a sustainable return.
It is anticipated that capital investment will double in 2016. A clear and focused plan is in place to grow sustainably and improve the quality of the estate, which began with the commencement of the substantial refit programme in the second half of the 2015 financial year. As mentioned previously, we remain committed to reducing our per square metre capital spend without compromising on the quality of our supermarkets. All future capital commitments will be funded through internally generated cash flow and medium- to long-term borrowings where appropriate.
Pick n Pay Holdings Limited RF
Pick n Pay Holdings Limited RF’s only asset is its 52.8% (2014: 53.6%) direct holding of the issued share capital of Pick n Pay Stores Limited. Its earnings are directly related to those of this investment.
KEY FINANCIAL INDICATORS
52 weeks to |
52 weeks to |
% |
|
Turnover |
R66.9 billion |
R63.1 billion |
6.1 |
Gross profit margin |
17.8% |
17.5% |
|
Trading profit |
R1 238.6 million |
R1 008.1 million |
22.9 |
Trading profit margin |
1.9% |
1.6% |
|
Profit before tax |
R1 203.7 million |
R830.9 million |
44.7 |
Profit before tax margin |
1.8% |
1.3% |
|
Basic earnings per share |
88.78 cents |
60.61 cents |
46.5 |
Headline earnings per share |
88.01 cents |
68.83 cents |
27.9 |
Annual dividend per share |
57.25 cents |
44.30 cents |
29.2 |
Pick n Pay Stores Limited and Pick n Pay Holdings Limited RF
Shareholder distribution
The Board of Pick n Pay Stores Limited has maintained its dividend cover of 1.5 times headline earnings per share. Pick n Pay Holdings Limited RF’s dividend policy is to pay out all profits for the year.
Pick n Pay Stores Limited declared a final dividend of 98.50 cents per share, bringing the total annual dividend for the year to 118.10 cents per share, 28.0% up on last year.
Pick n Pay Holdings Limited RF declared a final dividend of 47.85 cents per share, bringing the total annual dividend for the year to 57.25 cents per share, 29.2% up on last year.

Bakar Jakoet
Chief Finance Officer
Cape Town
20 April 2015