OUR PERFORMANCE
Pick n Pay Women's Walk Chief Executive Officer's report Chief Finance Officer's report Five-year review Value added statement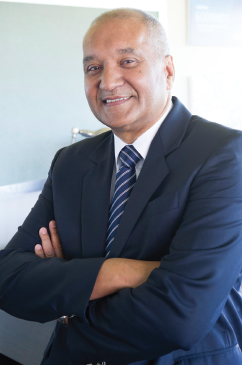
Bakar Jakoet
Strong financial control and tighter operating efficiency across the business has been key to our improvement in trading profit.
Chief Finance Officer’s report continued
During the period under review, trading income previously included under cost of merchandise sold has been reclassified and disclosed separately. This has been done to improve visibility of all other trading income, specifically commissions received. The prior year has been restated to align with the current year disclosures. Refer to note 31 of the Group financial statements for more detail.
The decrease in commissions and other income is mainly due to customers moving away from purchasing airtime at the till to other digital platforms. Franchise fee income was invested in our support of certain emerging markets franchisees.
Trading expenses
Trading expenses increased by 5.3% and as a percentage of turnover, decreased from 17.1% to 16.7%. Our teams across the business have been extremely focused on expense control and on improving productivity and efficiency, and we are pleased with the progress made over the year, with like-for-like expense growth (removing the impact of new and closed stores) of less than 1%, against CPI growth for the year of 5.8%.
| 364 days 2014 Rm |
% of 364-day turnover 2014 |
368 days 2013 Rm |
% of 364-day turnover 2013 |
% change |
Like-for-like % change |
||
| Trading expenses | 10 530.2 | 16.7 | 10 001.9 | 17.1 | 5.3 | 0.8 | |
| Employee costs | 5 326.3 | 8.4 | 4 952.0 | 8.4 | 7.6 | 3.2 | |
| Occupancy | 1 613.9 | 2.6 | 1 500.5 | 2.6 | 7.6 | 2.6 | |
| Operations | 2 580.5 | 4.1 | 2 363.9 | 4.0 | 9.2 | 4.1 | |
| Merchandising and administration | 1 009.5 | 1.6 | 1 185.5 | 2.0 | (14.8) | (17.9) | |
Employee costs
The Group is focused on increasing labour productivity in the business and on reducing labour costs. We contained the increase in employee costs at 7.6%, notwithstanding our new store growth and a new three-year wage agreement which came into force at the beginning of the financial year, and included an above-CPI wage rate increase for the year. Like-for-like employee cost growth is 3.2%.
The roll-out of our new Kronos labour scheduling system is complete, and is helping us to staff our stores more efficiently and effectively. One of our strategic objectives is to be the employer of choice in the retail industry, which incorporates the principle of providing employee benefits which are fair and just in order to attract the best talent in the retail industry. Cost savings will therefore come from increased productivity and efficiency and we look forward to working together with our teams and unions in this regard. Customer service remains a priority at Pick n Pay and we provide our staff with ongoing training in this area.
We continued with the centralisation of our finance and administration functions, removing duplicate costs and services in the business. This process necessitated tough decisions during the year and resulted in the retrenchment of some head office support staff. This was a difficult time for the business, but the rigorous review of all support structures and processes has enabled us to create a more streamlined and effective support office.
Occupancy costs
The 7.6% increase in occupancy costs is in line with the Group’s store expansion programme, with the like-for-like increase at 2.6%. This is pleasing in light of the continued above CPI regulatory increases in rates and taxes. We remain a tenant of choice in the retail industry and are able to negotiate competitive rentals and escalation terms with our landlords. Escalation terms average 6.5%.
Operations
The 9.2% increase reflects our opening of 80 company-owned stores during the 2014 financial year, with the like-for-like increase at 4.1%. Electricity usage is well controlled, and we have an effective programme of reducing energy use in our stores. However, administered price increases are resulting in significantly higher costs. Amortisation and depreciation has increased by 5.9%, compared with the 10.8% growth seen in 2013, which illustrates the good work being done around the control of capital expenditure and ensuring the spend is targeted at improving the customer offer.
Merchandising and administration
We are pleased with the progress made on eliminating excess administrative costs in the business, particularly at support office level. Merchandise and administration expenses have decreased by 14.8%, with a like-for-like decrease of 17.9%. We have almost entirely removed consultancy costs from the business. As South Africa’s largest acceptor of electronic tender, we have experienced increased bank fees as our customers move from debit cards to hybrid cards. We are encouraged that the Reserve Bank has taken action to reduce bank interchange fees in respect of credit, debit and hybrid costs. The reduced fee schedule is expected to be in force from 1 January 2015, with the benefits flowing in the 2016 financial year.
Trading profit
The trading profit margin improved from 1.3% to 1.6%. Expense control has been the key differentiator in our improved performance this year, countering the subdued turnover growth and continued investment in gross margin. We are very pleased with the good work being done around tighter fiscal control, with all areas of the business contributing to the expense savings. There is still a great deal of work to be done to optimise our cost structure and augment our productivity and efficiency, but we are demonstrating that we can run a lower cost, more streamlined business.
Loss on capital items
During the 2014 financial year the Group completed the centralisation of its buying, operational and finance support functions. As a result, systems and reporting tools previously developed to support the decentralised business operation became obsolete, necessitating an impairment review of certain intangible assets. Management estimated the recoverable amount (calculated as the higher of the value in use and the fair value less costs to sell) of the related intangible assets as zero and an impairment of R104.1 million was recognised in the statement of comprehensive income in the current reporting period. This impairment, net of the related tax effect of R29.1 million, has been added back in the calculation of headline earnings for the period under review. The loss on capital items also includes a loss on the sale of fixed assets of R5.5 million, against a profit of R21.6 million in the prior year.
Tax
The Group’s effective tax rate decreased from 31.9% to 29.9%. The value of the write-back of non-tax deductible expenditure is in line with last year, but as profit increases the impact of this non-deductible expenditure lessens, resulting in a reduction of the overall effective tax rate.
Earnings per share
Basic earnings per share (EPS) increased 6.0% from 115.14 cents to 122.01 cents per share. The new 52-week reporting calendar reduced the current reporting period by four trading days compared with the prior year. The comparable EPS growth (if the impact of 14.64 cents per share attributable to the additional trading days last year is excluded) is 21.4%
Headline earnings per share (HEPS) increased 24.4% from 111.30 cents to 138.51 cents per share. The new 52-week reporting calendar reduced the current reporting period by four trading days compared with the prior year. The comparable HEPS growth (if the impact of 14.64 cents per share attributable to the additional trading days last year is excluded) is 43.3%.
The significant difference in the growth in headline earnings per share against basic earnings per share is the exclusion of profits and losses of a capital nature in the calculation of headline earnings. Capital losses net of tax of R78.9 million are added back to headline earnings in 2014 (mainly comprising the impairment of intangible assets), against a deduction net of tax of R18.4 million of capital profits in 2013.
Net working capital
| As at 2 March 2014 Rm |
As at 3 March 2013 Rm |
|
| Inventory | 3 979.8 | 3 996.5 |
| Other current assets | 2 844.6 | 2 361.1 |
| Cash and cash equivalents | 1 540.3 | 1 255.7 |
| Bank overdraft and overnight borrowings | (670.0) | (1 525.6) |
| Other current liabilities | (8 942.2) | (7 382.4) |
| Net working capital | (1 247.5) | (1 294.7) |
We are pleased with the slight improvement in net working capital, particularly in the context of the store expansion programme.
Inventory
Inventory has decreased by R16.7 million or 0.4%, with like-for-like inventory (excluding the impact of new stores) decreasing by 5.7%. We have been focused on removing slow-moving inventory lines from our business, rationalising our product range to provide our customers with a more focused and relevant offering, as well as improving our supply chain efficiencies with improved strike rates to stores. We are pleased with our progress in this area, but there is still much work to be done.
Trade and other receivables
The increase of R480.0 million relates to the 12 net new franchise stores. Franchise receivables are well controlled, but our exposure to emerging market franchisees has resulted in a net increase in our allowance for impairment losses of R43.2 million. More than 90% of the trade receivables balance relates to franchisees that have an excellent credit history with the Group.
Cash and capital management
Working capital management is critical in maintaining a sustainable and cost-effective capital structure, and as such the Group’s liquidity position is continually monitored. The net cash and overnight borrowing position at year-end has improved by R1 140.2 million on last year, from negative R269.9 million to R870.3 million. The improved cash position is testament to the good work being done in respect of inventory management and improved fiscal control over both capital and operating expenditure. We raised an additional R300 million borrowing under our DMTN programme to capitalise on competitive interest rates in the capital markets.
The Group utilises interest-bearing borrowings to fund specifically identified capital expenditure. All capital expenditure is reviewed through a rigorous requisition and approval process.
The net interest expense of R99.6 million is R11.1 million more than the prior year’s expense of R88.5 million, due to periods of elevated borrowings during the financial year as a result of increased capital expenditure and inventory provisioning relating to new stores, particularly in the first half of the year.
Cash outflows for the period relate to capital expenditure of R1.3 billion, with 72% (R911 million) of our capital investment focused in expansion and improving the shopping experience.
| 2014 Rm |
2013* Rm |
|
| Capital expenditure | ||
| Expansion into new stores | 592 | 539 |
| Improving existing stores | 319 | 340 |
| Improving the customer experience | 911 | 879 |
| Investing in future infrastructure | 158 | 328 |
| Maintaining current infrastructure | 191 | 88 |
| Total capital expenditure | 1 260 | 1 295 |
* Restated to accord with current year reclassifications.
Capital commitments to the value of R1.6 billion are planned for the 2015 financial year. The focus will remain on expanding our footprint and our convenience offering to our customers. We will add more than 100 stores, across all formats, next year. We are committed to reducing our per square metre capital expenditure spend, without compromising on the quality of our supermarkets. All future capital commitments will be funded through internally generated cash flow, the roll-over of our Domestic Medium Term Note (DMTN) programme and longer-term borrowings, where appropriate.
PICK N PAY HOLDINGS LIMITED RF
Pick n Pay Holdings Limited RF’s (Pikwik) only asset is its 53.6% (2013: 53.6%) effective holding in Pick n Pay Stores Limited (excluding treasury shares). The Pikwik earnings are directly related to those of this investment. The table below highlights the key financial indicators:
| 364 days 2014 |
Normalised trading calender 364 days (pro forma) 2013 |
Comparable pro formal change % |
As previously reported 368 days 2013 |
% change |
|
| Total till sales | R73.0 billion | R67.8 billion | 7.6 | R68.5 billion | 6.5 |
| Turnover | R63.1 billion | R58.6 billion | 7.7 | R59.3 billion | 6.5 |
| Gross profit margin | 17.5% | 17.5% | 17.4% | ||
| Trading profit | R1 008.1 million | R749.8 million | 34.4 | R850.5 million | 18.5 |
| Profit before tax | R830.9 million | R706.3 million | 17.6 | R807.0 million | 3.0 |
| Basic earnings per share | 60.61 cents | 49.87 cents | 21.5 | 57.03 cents | 6.3 |
| Headline earnings per share | 68.83 cents | 47.95 cents | 43.5 | 55.11 cents | 24.9 |
| Total annual dividend per share | 44.30 cents | 40.78 cents | 8.6 |
PICK N PAY STORES LIMITED AND PICK N PAY HOLDINGS LIMITED RF
Shareholder distribution
In line with our review of all aspects of the business, the Board of Pick n Pay Stores Limited has moderated its annual dividend cover to 1.5 times headline earnings per share. Pick n Pay Holdings Limited RF’s dividend policy is to pay out all profits for the year. The final dividend of 77.50 cents per share for Pick n Pay Stores Limited and 37.10 cents per share for Pick n Pay Holdings Limited RF brings the total dividend for the annual period to 92.30 cents per share for Pick n Pay Stores Limited (9.9% up on the comparable period) and 44.30 cents per share for Pick n Pay Holdings Limited RF (8.6% up on the comparable period).
Prospects
It has been a challenging but rewarding year and we are pleased by this improved financial performance and the progress demonstrated across all areas of our business. However, much work remains to be done in what is a difficult trading environment. Our strategic focus remains on the dual goals of improving our customer offer in order to drive turnover growth, and continuing the encouraging progress on efficiency and expense control.

Bakar Jakoet
Chief Finance Officer
Cape Town
14 April 2014